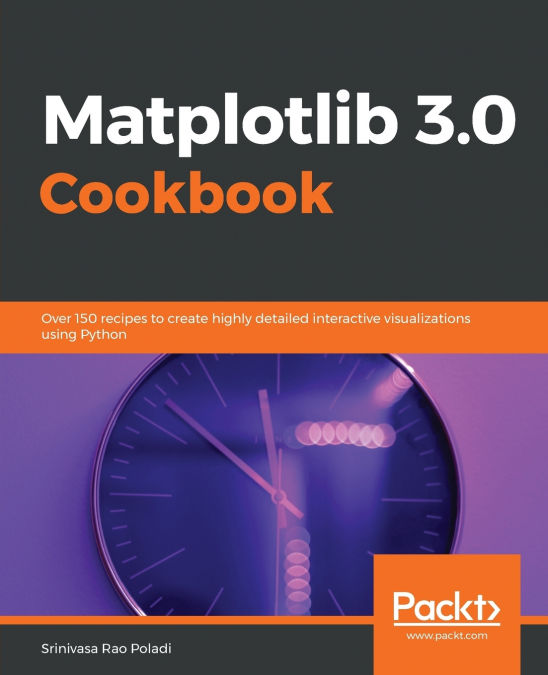
Matplotlib 2.x Cookbook

Matplotlib 2.x Cookbook

Matplotlib 2.x Cookbook

Srinivasa Rao Poladi

68,94 €
IVA incluido
Disponible
Editorial:
Packt Publishing
Año de edición:
2018
Materia
Diseño y teoría de bases de datos
ISBN:
9781789135718
68,94 €
IVA incluido
Disponible
Añadir a favoritos

Artículos relacionados

  • Applied Data Science with Python and Jupyter
    Alex Galea
    ...
    Disponible

    42,67 €

  • An Introduction to Laplacian Spectral Distances and Kernels
    Giuseppe Patanè
    In geometry processing and shape analysis, several applications have been addressed through the properties of the Laplacian spectral kernels and distances, such as commute time, biharmonic, diffusion, and wave distances.Within this context, this book is intended to provide a common background on the definition and computation of the Laplacian spectral kernels and distances for ...
  • Individual and Collective Graph Mining
    Christos Faloutsos / Danai Koutra
    Graphs naturally represent information ranging from links between web pages, to communication in email networks, to connections between neurons in our brains. These graphs often span billions of nodes and interactions between them. Within this deluge of interconnected data, how can we find the most important structures and summarize them? How can we efficiently visualize them? ...
  • Representation, Inclusion, and Innovation
    Clayton Lewis
    A representation is a thing that can be interpreted as providing information about something: a map, or a graph, for example. This book is about the expanding world of computational representations, representations that use the power of computation to provide information in new forms, and in new ways. Unlike printed maps or graphs, computational representations can be dynamic, ...
  • User-Centered Evaluation of Visual Analytics
    Jean Scholtz
    Visual analytics has come a long way since its inception in 2005. The amount of data in the world today has increased significantly and experts in many domains are struggling to make sense of their data. Visual analytics is helping them conduct their analyses. While software developers have worked for many years to develop software that helps users do their tasks, this task is ...
  • Mastering Kibana 6.x
    Anurag Srivastava
    ...
    Disponible

    59,08 €